

Can Machine Learning Improve the Way We Monitor System Health?
- Samuel Roberts

- Dec 18, 2025
- 8 min read
Updated: May 12
I know what you’re thinking, “Oh great, another blog about AI. How very 2025” or “What does this guy know about AI?”.
But this one isn’t about sprinkling a bit of AI over something that already works just to sound modern. It didn’t start with the question “where can I use AI?”. It started with a much simpler one:
“Is there a better way to do this?”
Recently, I wrote about designing and hosting a small system to run our git, documentation, and communication services. One thing I didn’t touch upon in that post, but which inevitably comes with the territory, is monitoring. Any system you care about needs to tell you when it’s healthy. Or perhaps more pertinently, unhealthy.
So I did what I’ve done previously and installed Prometheus and Grafana, collected metrics, and configured some very basic alerts.
Almost immediately, I started questioning whether the way we monitor systems today is actually fit for purpose.
The Real Problem That Started This
One of the services running on this system includes a “once every so often” task that is intentionally CPU heavy. When it runs, CPU usage spikes hard. I know this because I’ve watched it happen as it runs, and been on the wrong side of multiple alerts to slack.
Because of that, I have limited the resources available to that job and have scheduled the task to run overnight, at the weekend, when the system is otherwise quiet and not in active use. At that point, high CPU utilisation (within reason) is not only safe, it is desirable. The system is doing exactly what it is meant to be doing.
From a traditional monitoring point of view though, this looks bad.
CPU goes high, stays there for seven minutes, and crosses every static threshold I have ever configured. If I rely purely on those alerts I would either be pinged for no reason, or I would disable the alert entirely.
Neither option is particularly good.
That was the moment that prompted this whole voyage of discovery. The system was behaving correctly, but my monitoring could not understand that.
The Way We’ve Always Done It
When we talk about monitoring, we usually break it down into three areas:
For the purpose of this article, I’m going to focus purely on metrics.
Metrics are data points that describe the state of a system at a single moment in time. Think CPU usage, memory consumption, disk utilisation, and similar signals.
Take CPU usage as an example.
The CPU is the component that does the work. If it is under sustained heavy load, performance can degrade and the system can become unstable. Because of that, it is useful to be alerted when CPU utilisation reaches an “unsafe” level.
Historically, I have approached this in roughly the same way. If CPU utilisation is over 80 percent for more than, say, five minutes, someone gets alerted and appropriate action can be taken. I’ve configured literally hundreds in this way during my career.
It is simple, understandable, and easy to justify.
It is also deeply flawed.
The Problem With Static Thresholds
The core issue is context.
Looking at five minutes of CPU usage in isolation does not tell the full story of how the system is behaving.
Is this a normally idle system or a consistently busy one?Does CPU spike every night for scheduled jobs?Has usage been slowly increasing for hours, or did it jump suddenly?Is high CPU normal for this workload, or is it genuinely unusual?
In the case of my overnight task, high CPU is expected and safe. In the middle of the day, that same behaviour might be a serious problem.
Static thresholds cannot tell the difference.
Over time, this leads to alerts that fire when nothing is actually wrong. Those alerts get investigated, dismissed, and slowly lose credibility. Eventually, people stop trusting them, leading to alert fatigue. Nosier alerting rules doesn’t actually mean better alerting, it can be the opposite.
That may sound over the top, but I spent two months at my last place of work building a Python tool to track, report on, and help the team investigate infrastructure alerts because a great many of them were being ignored for exactly this reason.
That is not a tooling problem. It is a modelling problem.
Thinking in Terms of Behaviour, Not Numbers
Instead of asking “is this number too high?”, I started thinking about asking different question and decided on the following:
“Is the system behaving unusually right now?”
That small shift could change how we think about monitoring entirely.
Rather than treating each metric as an isolated number, we can treat metrics as signals that describe behaviour over time.
Introducing z-score
At this point, it helps to put a name to what I am describing.
I did some research and decided that the way I would measure unusual behaviour was by using a statistical concept called z-score.
A z-score describes how far away a value is from what is considered normal, relative to recent variability. In simple terms, it answers the question:
“How unusual is this compared to what the system normally does?”
To calculate it, three things are needed, all taken from a rolling window of recent data:
The current value (for example, the current CPU utilisation)
The rolling average over a recent period of time (what “normal” looks like right now)
The rolling standard deviation over that same period (how much the system usually fluctuates)
The calculation looks like this:
z-score = (current value - rolling average) / rolling standard deviation
If the z-score is close to zero, the system is behaving exactly as expected. As the absolute value increases, the behaviour becomes more unusual. A z-score above three, or below minus three, is commonly considered statistically abnormal.
What matters here is not the absolute CPU value, but how it relates to recent behaviour.
A CPU spike from six percent to six point five percent can be unusual if the system has been extremely stable. A spike to eighty-five percent might not be unusual at all if the system has been volatile and behaving that way regularly.
We are no longer asking whether CPU is high. We are asking whether CPU behaviour is unusual.
What z-score Gives Us on Its Own
Let’s add some visuals to help.
Fig 1

This shows the raw, cleaned CPU metrics over time. This is the data we are used to seeing in Grafana. It tells us what happened, but it does not tell us whether what happened was expected or unusual. All big spikes shown are different executions of the same pipeline job, typically lasting between two and seven minutes depending on success or failure.
Before introducing machine learning at all, plotting z-score by itself already tells an interesting story. The below image looks like we’re visualising a completely different dataset, and technically we are, but it is based on the same CPU metrics as above.
Fig 2

By graphing z-score over time, we can clearly see periods where system behaviour deviates from its recent baseline.
In the case of my overnight task, CPU usage goes high, but the z-score tells a more nuanced story. On fig 1, you can clearly see the overnight task. On fig 2 it’s not so clear. Initially, the spike looks unusual. As the job continues and the rolling baseline adjusts, the behaviour becomes less abnormal. The system is settling into a new short-term normal.
Even without any machine learning, this is a meaningful improvement in transposing the thing we are measuring. Z-score-based monitoring is far more expressive than static thresholds because it captures behaviour rather than fixed limits.
Fig 3

However, as fig 3 shows, it still only understands the recent past. This shows CPU usage in blue, and z-score based anomalies in red. That’s a lot of dots. If we stopped here, and configured alerts to fire when an anomaly is detected, we would end up with an even noisier alerting system than we started with. In truth, that’s largely down to how stable this system is right now, so even the smallest change is “unusual”. You’ll see in a moment, though, that we can do much better when we introduce machine learning.
Where Machine Learning Fits
Up to this point, nothing requires machine learning. That is intentional.
Machine learning only becomes useful when we hit the limitation we saw in fig 3.
Even with a rolling baseline, we are still mostly looking at short-term context. We are asking whether something is unusual compared to the last hour.
Systems also have long-term patterns.
They run nightly jobs. They follow weekly cycles. They experience predictable spikes that have never caused problems. Certain combinations of metrics matter far more together than they do in isolation.
This is where machine learning starts to make sense.
Instead of trying to encode every exception and edge case by hand, a model can learn from historical behaviour and help answer a more useful question:
“Is this pattern of behaviour unusual in the context of everything this system has done before?”
This is not about predicting the future or handing control to an algorithm. It is about filtering noise.
If the system is behaving in a way that is unusual right now, and that behaviour does not resemble patterns that have historically been typical or safe, then it is probably worth alerting a human.
In the case of my overnight CPU heavy task, the goal is simple: allow the system to learn that these CPU spike patterns have historically been safe, and stop treating them as emergencies.
Seeing the Difference
Looking at the same data through different lenses is where the value of this approach becomes obvious.
Fig 4

This shows the output of a machine learning model, based on an anomaly detection algorithm called isolation forest, trained directly on those same CPU metrics from fig 1. Initially, high CPU events are flagged as anomalies because they are rare relative to the historical distribution. However, as similar events accumulate, the model incorporates them into its understanding of normal behaviour, and subsequent high-CPU events are no longer flagged. This happens because the model only cares about how often a pattern appears overall, not when it happens.
Fig 5
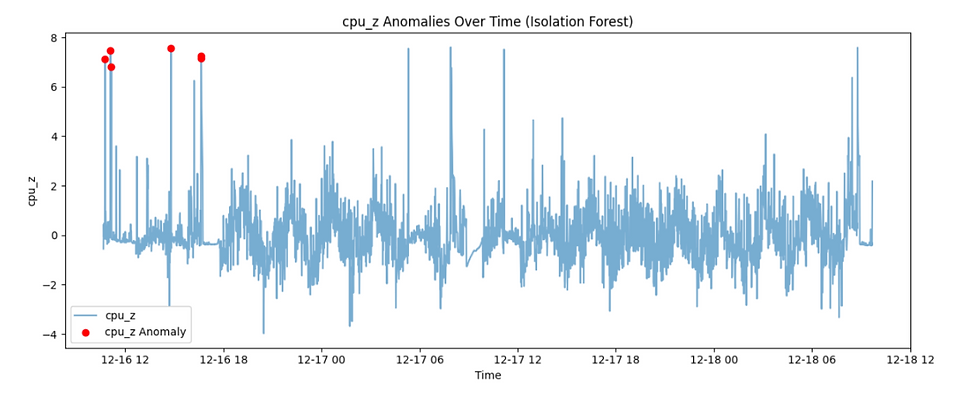
Fig 5 shows the same algorithm applied to z-scores instead of raw CPU values. Here, the
model no longer detects absolute CPU spikes. Instead, it detects statistically rare deviations relative to recent behaviour. Sustained high-load periods produce moderate z-scores and are treated as normal, while smaller deviations during otherwise stable periods may be flagged because they are more isolated in the normalized feature space.
It is worth noting that the algorithm is not flagging the largest z-scores, but the most isolated ones. Isolation-based models care about rarity, not magnitude.
Why This Combination Matters
This combination is where things become genuinely interesting.
Z-score captures short-term behavioural context. The machine learning algorithm adds longer-term historical context. Together, they allow the system to distinguish between behaviour that is merely different and behaviour that is both unusual and historically atypical.
Each step removes a little more noise and adds a little more understanding.
The goal is not fewer alerts at any cost. The goal is better alerts.
This approach is still in its infancy, but even with a relatively small amount of data, it is already clear that this could be a more effective way to monitor systems.
Limitations and Open Questions
This approach does not eliminate the need for explicit alerts, nor does it remove the need for human judgement.
Statistical models reflect past behaviour. If a system slowly degrades, or settles into a consistently unhealthy state, that behaviour can become normalized unless additional safeguards are in place. Rare-but-catastrophic events may still evade detection, and domain knowledge remains essential.
This is not a silver bullet. It is a tool for improving signal quality.
This Is Not About AI for the Sake of It
This approach is not about replacing engineers or blindly trusting a black box. More importantly, it isn’t new. I began exploring this after reading articles and watching talks that were already several years old.
It is about adding context where there was none before. It is about letting systems describe their own normal behaviour. It is about reducing reliance on brittle, hard-coded alert rules that grow increasingly complex over time.
Machine learning is just one tool in that process. It only becomes useful once the fundamentals are in place.
Static thresholds got us this far. Systems are more complex now, and our monitoring needs to reflect that.
If we can ask better questions about system health, we stand a much better chance of getting useful answers.
Solution built with python using the isolation forest algorithm from sklearn:


